C. Combined Sewer Overflows
Polluted discharges from CSOs dropped 80% over two decades.
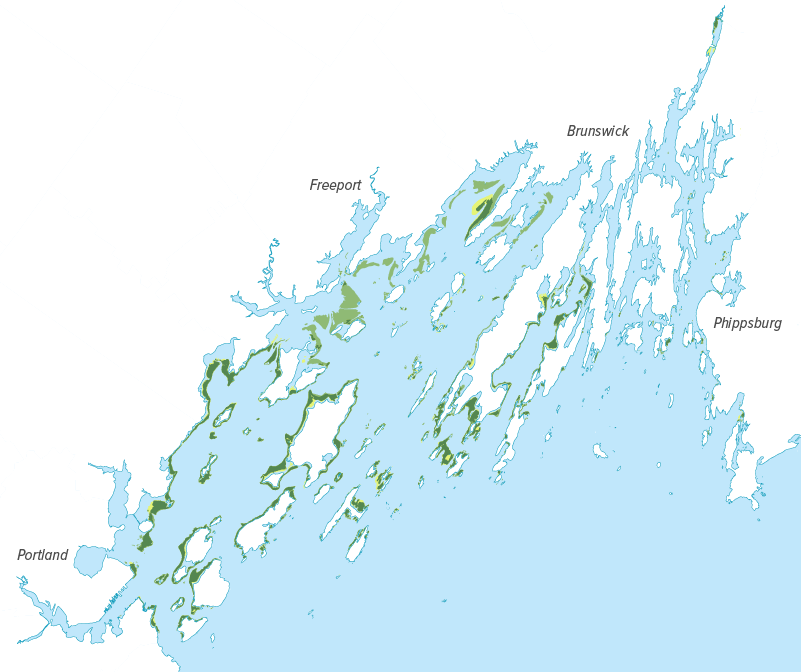
J. Eelgrass
Eelgrass increased from 2013 to 2018 but remains below historical abundance.
E. Climate Change
Air temperature increased and coastal flooding became more frequent during the past century.
H. Nutrients
Total nitrogen declined at three of five sites with long-term data…
…signaling improvements in water quality.
G. Bay Water Quality
Water temperatures increased more than 1.6°C (about 3°F) since 1993, and water clarity (Secchi depth) dropped slightly.
I. Aquatic Connectivity
Sea-run fish are regaining
access to the Presumpscot River watershed…
…but relic dams block fish from swimming up the Royal River, Stroudwater River, and some coastal streams.
View a PDF version of this page that can be downloaded and printed.
Selected data and data analysis code for certain indicators are available for review.
STATE OF CASCO BAY
Drivers & Stressors
What’s Affecting the Bay?
Human Connections
What’s Being Done?
If you would like to receive a printed State of Casco Bay report, send an email request to cbep@maine.edu.
This document has been funded by the U.S. Environmental Protection Agency under Cooperative Agreements #CE00A00348-0 and #CE00A00662-0 with the University of Southern Maine.
Suggested citation: Casco Bay Estuary Partnership. State of Casco Bay, 6th Edition (2021).
Photo at top of page: Jerry Monkman, Ecophotography.com

